Last updated: 8 October 2026. MoreLess
Every screenshot below was recorded on 8 October 2026 on an IQ Option Practice account registered in Brazil, on EUR/USD 5-minute candles; the Chart analysis picture in Step 1 was recorded on 5 October 2026. We placed no real-money trade. The tested box shows what a rule version of the strategy did on EUR/USD candles recorded between 29 September and 5 October 2026. The strategy draws its support and resistance lines by eye, so the rule below replaces them with the extremes of the previous 60 candles; it says nothing about what will happen next.
The strategy uses two simple moving averages, an SMA 10 and an SMA 30, and horizontal support and resistance lines on 5-minute candles. When the SMA 10 crosses the SMA 30 from below and the gap between them starts to widen, an uptrend is developing; the entry waits until the price has also broken a resistance line, and the trade is held for 30 minutes or more. A downtrend is the mirror. The lines are drawn by eye. A replay needs a rule, so we took the highest high and the lowest low of the previous 60 candles. The setup is rare: on 1,334 five-minute EUR/USD candles recorded between 29 September and 5 October 2026 it gave 9 signals, and the 30-minute trades won 6 and lost 3. Nine trades are far too few to say whether the strategy works, and other definitions of the support and resistance gave 50% and 43% on 14 and 28 signals.
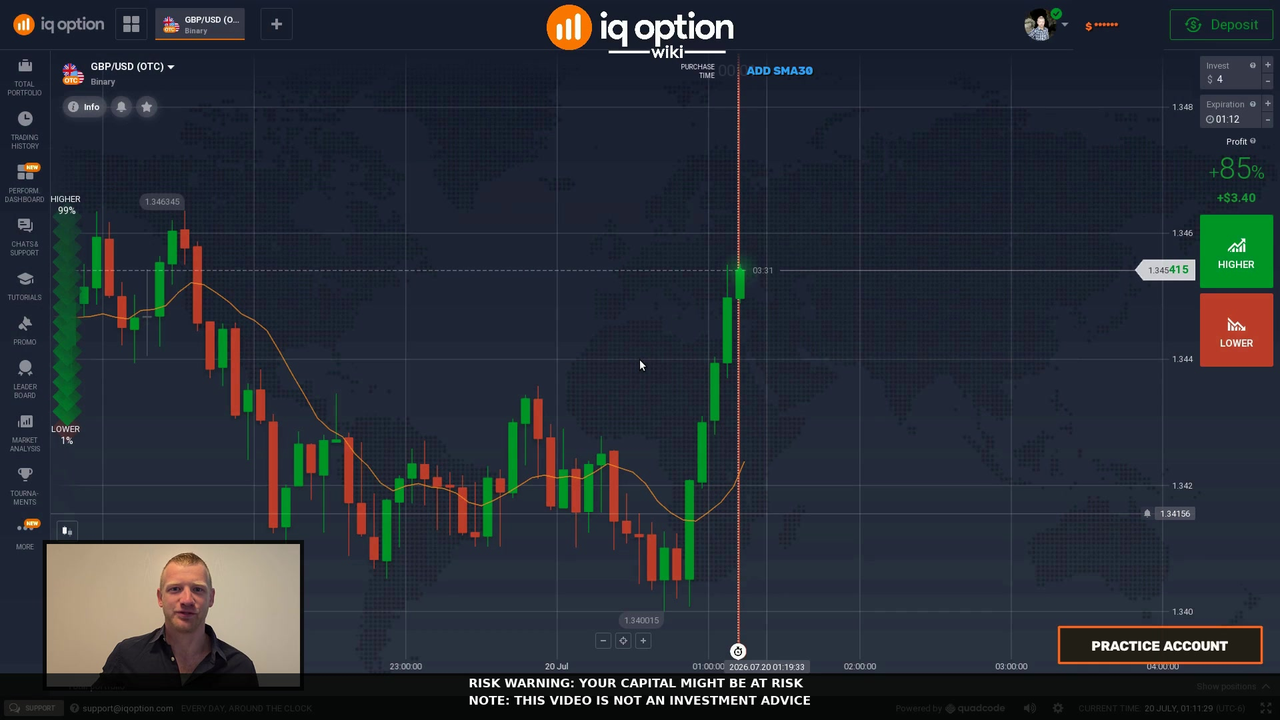
Video tutorial
Quick answer
- Indicators: a Simple Moving Average with a period of 10 and another with a period of 30, plus horizontal lines for support and resistance.
- Higher: the SMA 10 crosses above the SMA 30, the gap between them starts to widen, and the price has broken a resistance line.
- Lower: the SMA 10 crosses below the SMA 30, the gap starts to widen, and the price has broken a support line.
- Chart and trade: 5-minute candles; the trade lasts long, 30 minutes (6 candles) or more.
- Ranging market: if the two averages keep crossing and the gap stays narrow, the market is ranging and there is no entry.
- Tested: our rule gave 9 signals on 5-minute candles; 30-minute trades won 6 and lost 3. Break-even is 54.1% at an 85% payout, and a few days of one pair prove nothing.
How do you set up the SMA 10 and SMA 30 strategy?
Set the chart
Choose the asset, the chart type and the candle size first: the indicators are calculated from the candles on the chart. The examples in this guide use 5-minute candles on EUR/USD. These steps use the web traderoom on a Practice balance, and the numbers in each screenshot match the numbers in the text. If you do not have an account yet, see how to register.
Step 1: Open Chart analysis
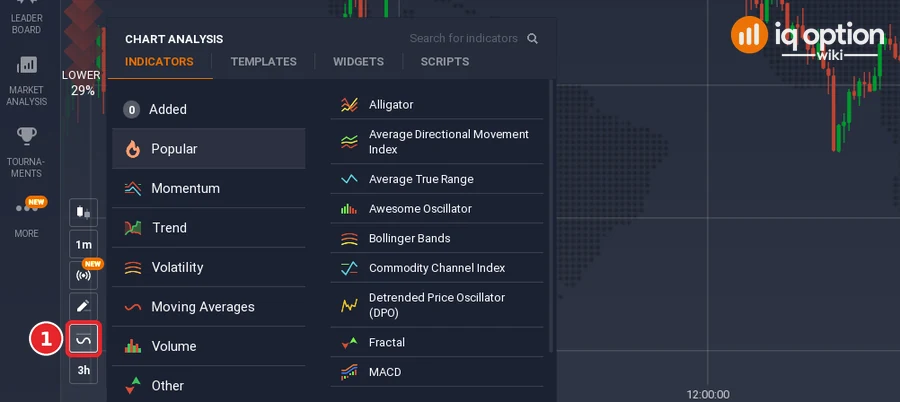
Click the indicators button (1), the wave icon in the chart toolbar at the bottom left of the chart. The Chart analysis panel opens with the tabs Indicators, Templates, Widgets and Scripts. Stay on Indicators.
Step 2: Find the Moving Average
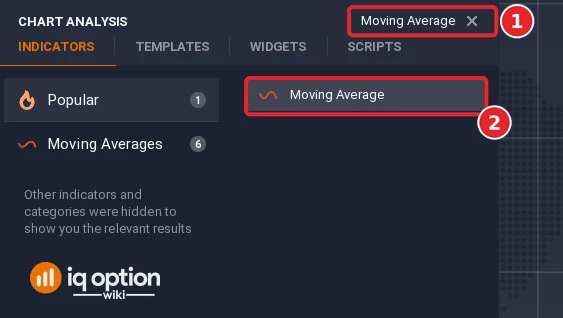
Type “Moving Average” in the Search for indicators box (1) and click Moving Average (2). The same entry gives the simple and the exponential average; you choose the type in the dialog.
Step 3: Add the SMA 10
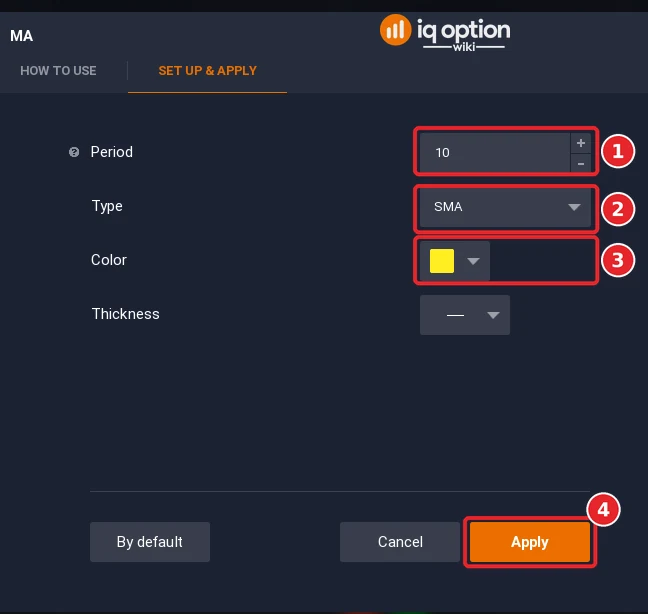
The dialog opens with a Period of 14 and the Type SMA. Type 10 in Period (1), keep the Type on SMA (2), pick a colour (3), yellow here, and click Apply (4).
Step 4: Add the SMA 30
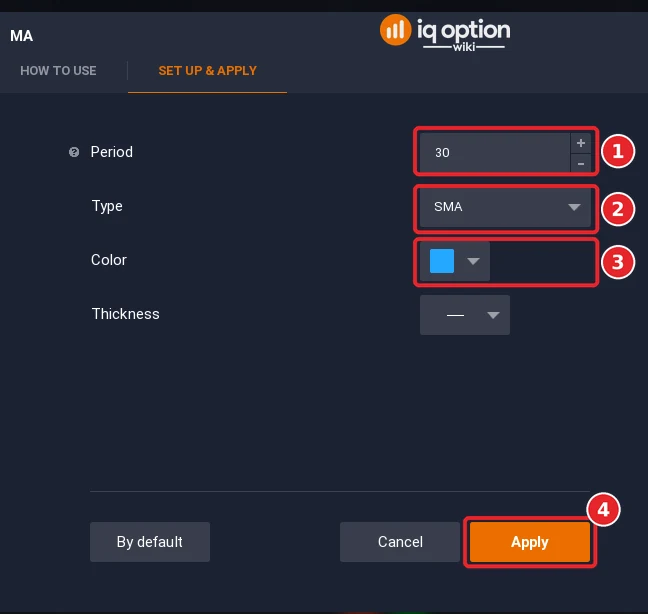
Open Chart analysis again and add a second Moving Average: Period 30 (1), Type SMA (2), a different colour (3), blue here, and Apply (4).
Step 5: Draw support and resistance
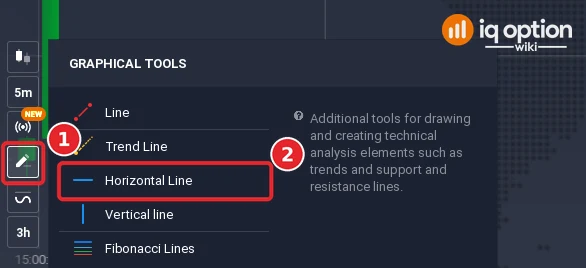
Click the drawing tools button (1) and choose the Horizontal Line tool (2), then click on the chart where the price has turned before. Draw one line under the recent lows for the support and one over the recent highs for the resistance. Our replay draws no lines: it takes the lowest low and the highest high of the previous 60 candles.
Step 6: Use 5-minute candles
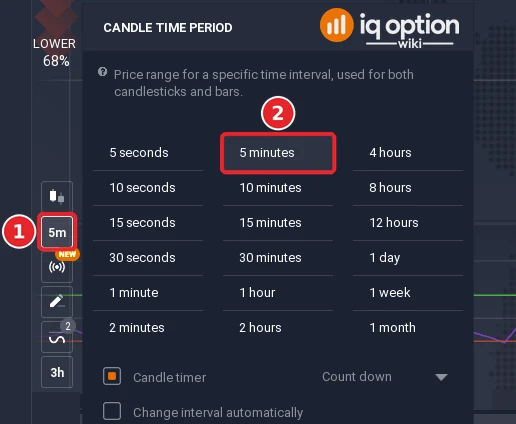
Click the candle time period button (1) in the toolbar at the left of the chart; it shows the current period, 5m in the picture. In the menu that opens, choose 5 minutes (2). The strategy advises against 1-minute candles and recommends 5-minute candles so that a trade can last 30 minutes or more.
Step 7: Read the two averages
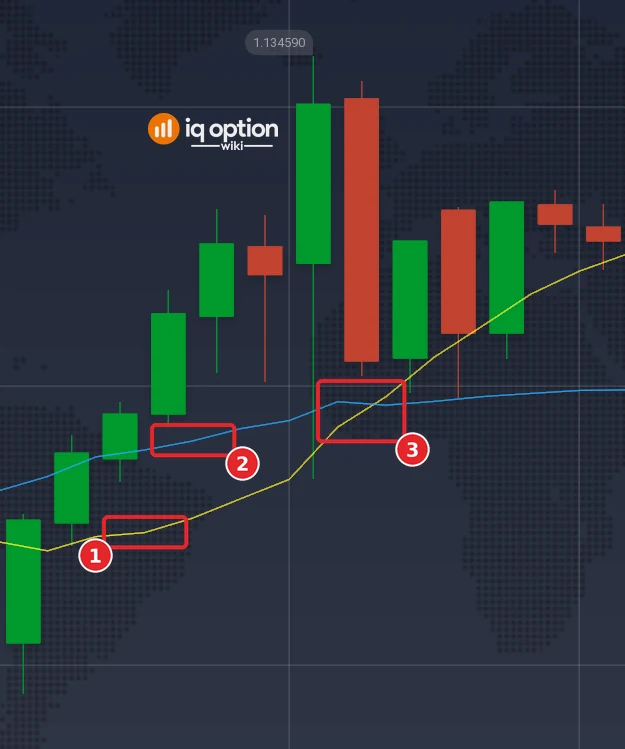
The SMA 10 (1), yellow here, follows the price closely; the SMA 30 (2), blue, is slower. When the faster line crosses the slower one (3) the gap between them starts to open: the first sign of a trend.
What does a long position mean here?
The strategy uses “long position” for a trade that lasts long, not for a buy. On a 5-minute chart that is about 30 minutes, six candles; a short trade on that chart would last 5 minutes. The argument is that a fluctuation of a few seconds can decide a 1-minute trade, but cannot change a 30-minute one much, and that a short time frame is harder to analyse. Holding longer does not make a trade certain to win; it only gives the trade a better chance.
What are the entry rules?
The two averages are read like this: when the SMA 10 cuts the SMA 30 from below and moves above it, with the gap between them widening, an uptrend is developing; the mirror holds for a downtrend; and if the two keep crossing with a narrow gap, the market is ranging. The entry needs the support or resistance as well. We read both lines off the platform’s chart at 31 and 32 candles of two windows and compared them with the simple average: the median difference was 0.01 pip for each line, and the platform draws the point of a candle at its close. Written so that every condition is checked on closed candles:
| Part | Usual rule | Our rule for the replay |
|---|---|---|
| Higher signal | The price breaks the resistance, the SMA 10 cuts the SMA 30 from below and the gap widens | The SMA 10 crosses above the SMA 30 on a candle, the gap is wider on the next candle, and within 6 candles before that a close was above the highest high of the previous 60 candles |
| Lower signal | The price breaks the support, the SMA 10 cuts the SMA 30 from above and the gap widens | The mirror, with the lowest low of the previous 60 candles |
| Entry | When the conditions hold | At the close of the candle on which the gap is wider |
| Expiry | 30 minutes or more | 30 minutes (6 candles); we also scored 15 and 5 minutes |
Two signals of the recording, step by step
The first Higher signal and the first Lower signal of the rule on 5-minute candles, in time order, not picked by outcome. All times are the platform clock, which is UTC minus three hours.
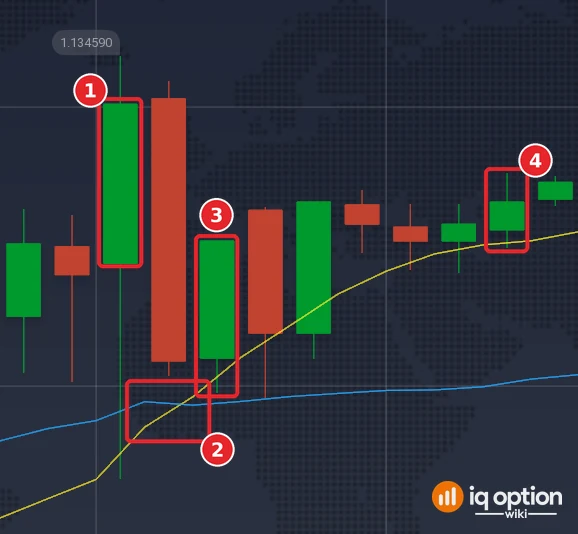
Higher signal, 29 September at 18:10
At the close of the candle that opened at 18:00 (1) the price stood at 1.134505, above the highest high of the previous 60 candles, 1.134365, which the candle that opened at 15:40 had set: the resistance was broken. At that close the SMA 10 (1.133927) was still 0.46 pip under the SMA 30 (1.133972). At the close of the next candle the SMA 10 was 0.15 pip above it (1.133981 against 1.133966): the cross upward (2). On the signal candle (3), which opened at 18:10 and closed at 18:15 at 1.13426, the gap was wider, 0.79 pip. All three conditions held, so the rule says Higher, and the trade opens at that close. A 30-minute trade ends at 18:45, when the candle (4) that opened at 18:40 closes at 1.13433, 0.7 pip higher: it won.
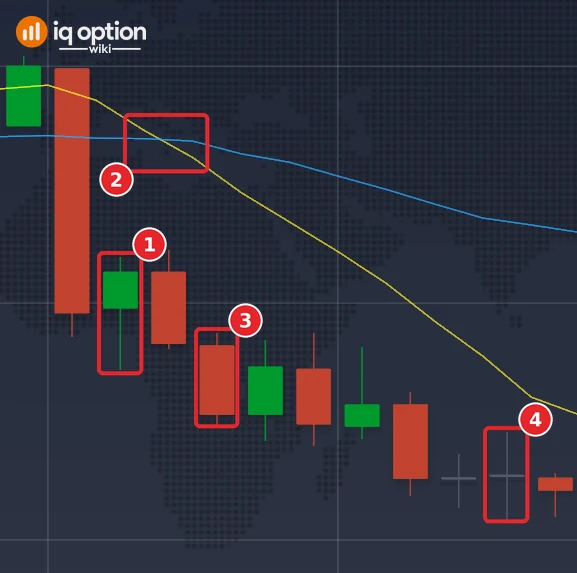
Lower signal, 30 September at 00:45
The candle that opened at 00:35 (1) had set the lowest low of the previous 60 candles, 1.13336. At the close of that candle the SMA 10 (1.133865) was 0.17 pip over the SMA 30 (1.133848); at the close of the next candle it was 0.35 pip under it (1.133808 against 1.133842): the cross downward (2). The signal candle (3) opened at 00:45 and closed at 00:50 at 1.133265, under that low, and the gap was wider, 0.82 pip. All three conditions held, so the rule says Lower, and the trade opens at that close. A 30-minute trade ends at 01:20, when the candle (4) that opened at 01:15 closes at 1.133135, 1.3 pips lower: it won.
The cross and break rule, tested
We scored the rule on the 1,334 five-minute candles of our recording, entering at the close of the signal candle and scoring the trade 30 minutes later; the box also shows 15-minute and 5-minute trades and two other definitions of the support and resistance.
Tested on IQ Option: the SMA 10 and SMA 30 break rule, EUR/USD candles of 29 September to 5 October 2026
| Asset and candles | EUR/USD binary (regular, not OTC): 1,334 five-minute candles (2026-09-29 01:55 to 2026-10-02 20:55 UTC and 2026-10-04 21:00 to 2026-10-05 17:00 UTC). The candles were recorded from IQ Option’s Practice traderoom. The replay places no orders; it only scores the rule on those closed candles, at an 85% payout. |
|---|---|
| Rule tested | The rule on closed candles, the option opening at the close of the signal candle: Higher when the SMA 10 crosses above the SMA 30 on a candle, the gap is wider on the next candle, and within 6 candles before that a close was above the highest high of the previous 60 candles (the resistance); Lower is the mirror with the lowest low of the previous 60 candles (the support). SMA 10 and SMA 30 as the platform draws them. The box lists the 30-minute trade on 5-minute candles first, then 15-minute and 5-minute trades and two other definitions of the lines. |
| Signals | SMA 10/30 cross and 60-candle break, 5-minute candles, 30-minute trade: 9 signals (3 Higher, 6 Lower) same, 15-minute trade: 9 signals (3 Higher, 6 Lower) same, 5-minute trade: 9 signals (3 Higher, 6 Lower) same with a 30-candle break, 30-minute trade: 14 signals (6 Higher, 8 Lower) same with a 20-candle break within 12 candles, 30-minute trade: 28 signals (14 Higher, 14 Lower) |
| Outcomes | SMA 10/30 cross and 60-candle break, 5-minute candles, 30-minute trade: 6 won, 3 lost, 0 tied; 66.7% of the 9 decided trades won; net +$0.23 per $1 staked at 85% (+$0.27 at 91%) same, 15-minute trade: 5 won, 4 lost, 0 tied; 55.6% of the 9 decided trades won; net +$0.03 per $1 staked at 85% (+$0.06 at 91%) same, 5-minute trade: 2 won, 6 lost, 1 tied; 25.0% of the 8 decided trades won; net −$0.48 per $1 staked at 85% (−$0.46 at 91%) same with a 30-candle break, 30-minute trade: 7 won, 7 lost, 0 tied; 50.0% of the 14 decided trades won; net −$0.07 per $1 staked at 85% (−$0.04 at 91%) same with a 20-candle break within 12 candles, 30-minute trade: 12 won, 16 lost, 0 tied; 42.9% of the 28 decided trades won; net −$0.21 per $1 staked at 85% (−$0.18 at 91%) |
| Break-even | At an 85% payout a trade needs to win more than 54.1% of its decided trades to break even (1 ÷ 1.85); at 91%, more than 52.4% (1 ÷ 1.91). |
A replay is only a look back at candles recorded on the dates above: it placed no real orders, covers about four and a half days of one pair, and counts overlapping trades as if they were independent. A short test proves nothing about the future, and no profit and no win rate is promised here. IQ Option’s own blog on backtesting says that most strategies need dozens, and often hundreds, of trades before a result means anything.
The rule gave 9 signals: 6 won and 3 lost with a 30-minute trade (66.7%), 5 and 4 with 15 minutes, and 2 won, 6 lost and 1 tied with 5 minutes. With 9 trades the 95% interval for the 30-minute result runs from about 35% to 88%. Taking the support and resistance from the previous 30 candles gave 14 signals and 50.0%, and from the previous 20 candles with a break up to 12 candles before the cross gave 28 signals and 42.9%. The result depends on how the lines are defined, which the strategy leaves to the trader, so these numbers cannot confirm or reject it.
Pros and Cons of the SMA 10 and SMA 30 strategy
| Pros | Cons |
|---|---|
| Longer trades reduce the effect of short fluctuations. | The setup is rare: 9 signals in 1,334 five-minute candles. |
| Two averages and two lines give a clear picture of trend and levels. | The support and resistance are drawn by eye, so a replay and a trader may disagree. |
| The widening gap filters crosses in a ranging market. | The strategy needs patience and may be hard for beginners. |
Common mistakes
- Entering on the cross alone. The strategy also wants the break of a support or resistance line and a widening gap.
- Using 1-minute candles. The logic of the strategy is that a longer trade ignores short fluctuations.
- Trading when the averages keep crossing. With a narrow gap the market is ranging.
- Taking the 30-minute result for granted. Six wins in nine trades is within chance.
- Drawing the lines after the move. Lines placed once you know the result always look right.
Related guides
- Two SMA lines on 1-minute candles and Trading with the SMA 20
- Support and resistance on IQ Option and Bollinger Bands with support and resistance
- Trading a ranging market
- All indicator guides and all strategy guides
Frequently Asked Questions
Q: What is the SMA 10 and SMA 30 strategy?
A: When the SMA 10 crosses the SMA 30 and the gap between them widens, and the price breaks a support or resistance line, it opens a long-lasting trade in the direction of the new trend.
Q: What does a long position mean in this strategy?
A: A trade that lasts long, not a buy: on a 5-minute chart about 30 minutes or six candles.
Q: Which candles does it use?
A: Five-minute candles. 1-minute candles are discouraged.
Q: How do I know the market is ranging?
A: If the SMA 10 and SMA 30 keep intersecting and the gap stays narrow, the market is ranging.
Q: Does the strategy win?
A: We could not tell. Our rule gave 9 signals in 4.5 days and 6 of the 30-minute trades won, which is too few trades to judge.
Q: Why SMA and not EMA?
A: The strategy uses simple averages. An exponential average follows the price more closely and would cross more often.